Forecast — Cash Flow Projection
Forecast predicts your account balance over the coming weeks and months. It factors in your current balances, your Rhythm recurring bills, your income, and your everyday spending habits to draw a projected cash flow timeline — so you can see potential shortfalls before they happen.
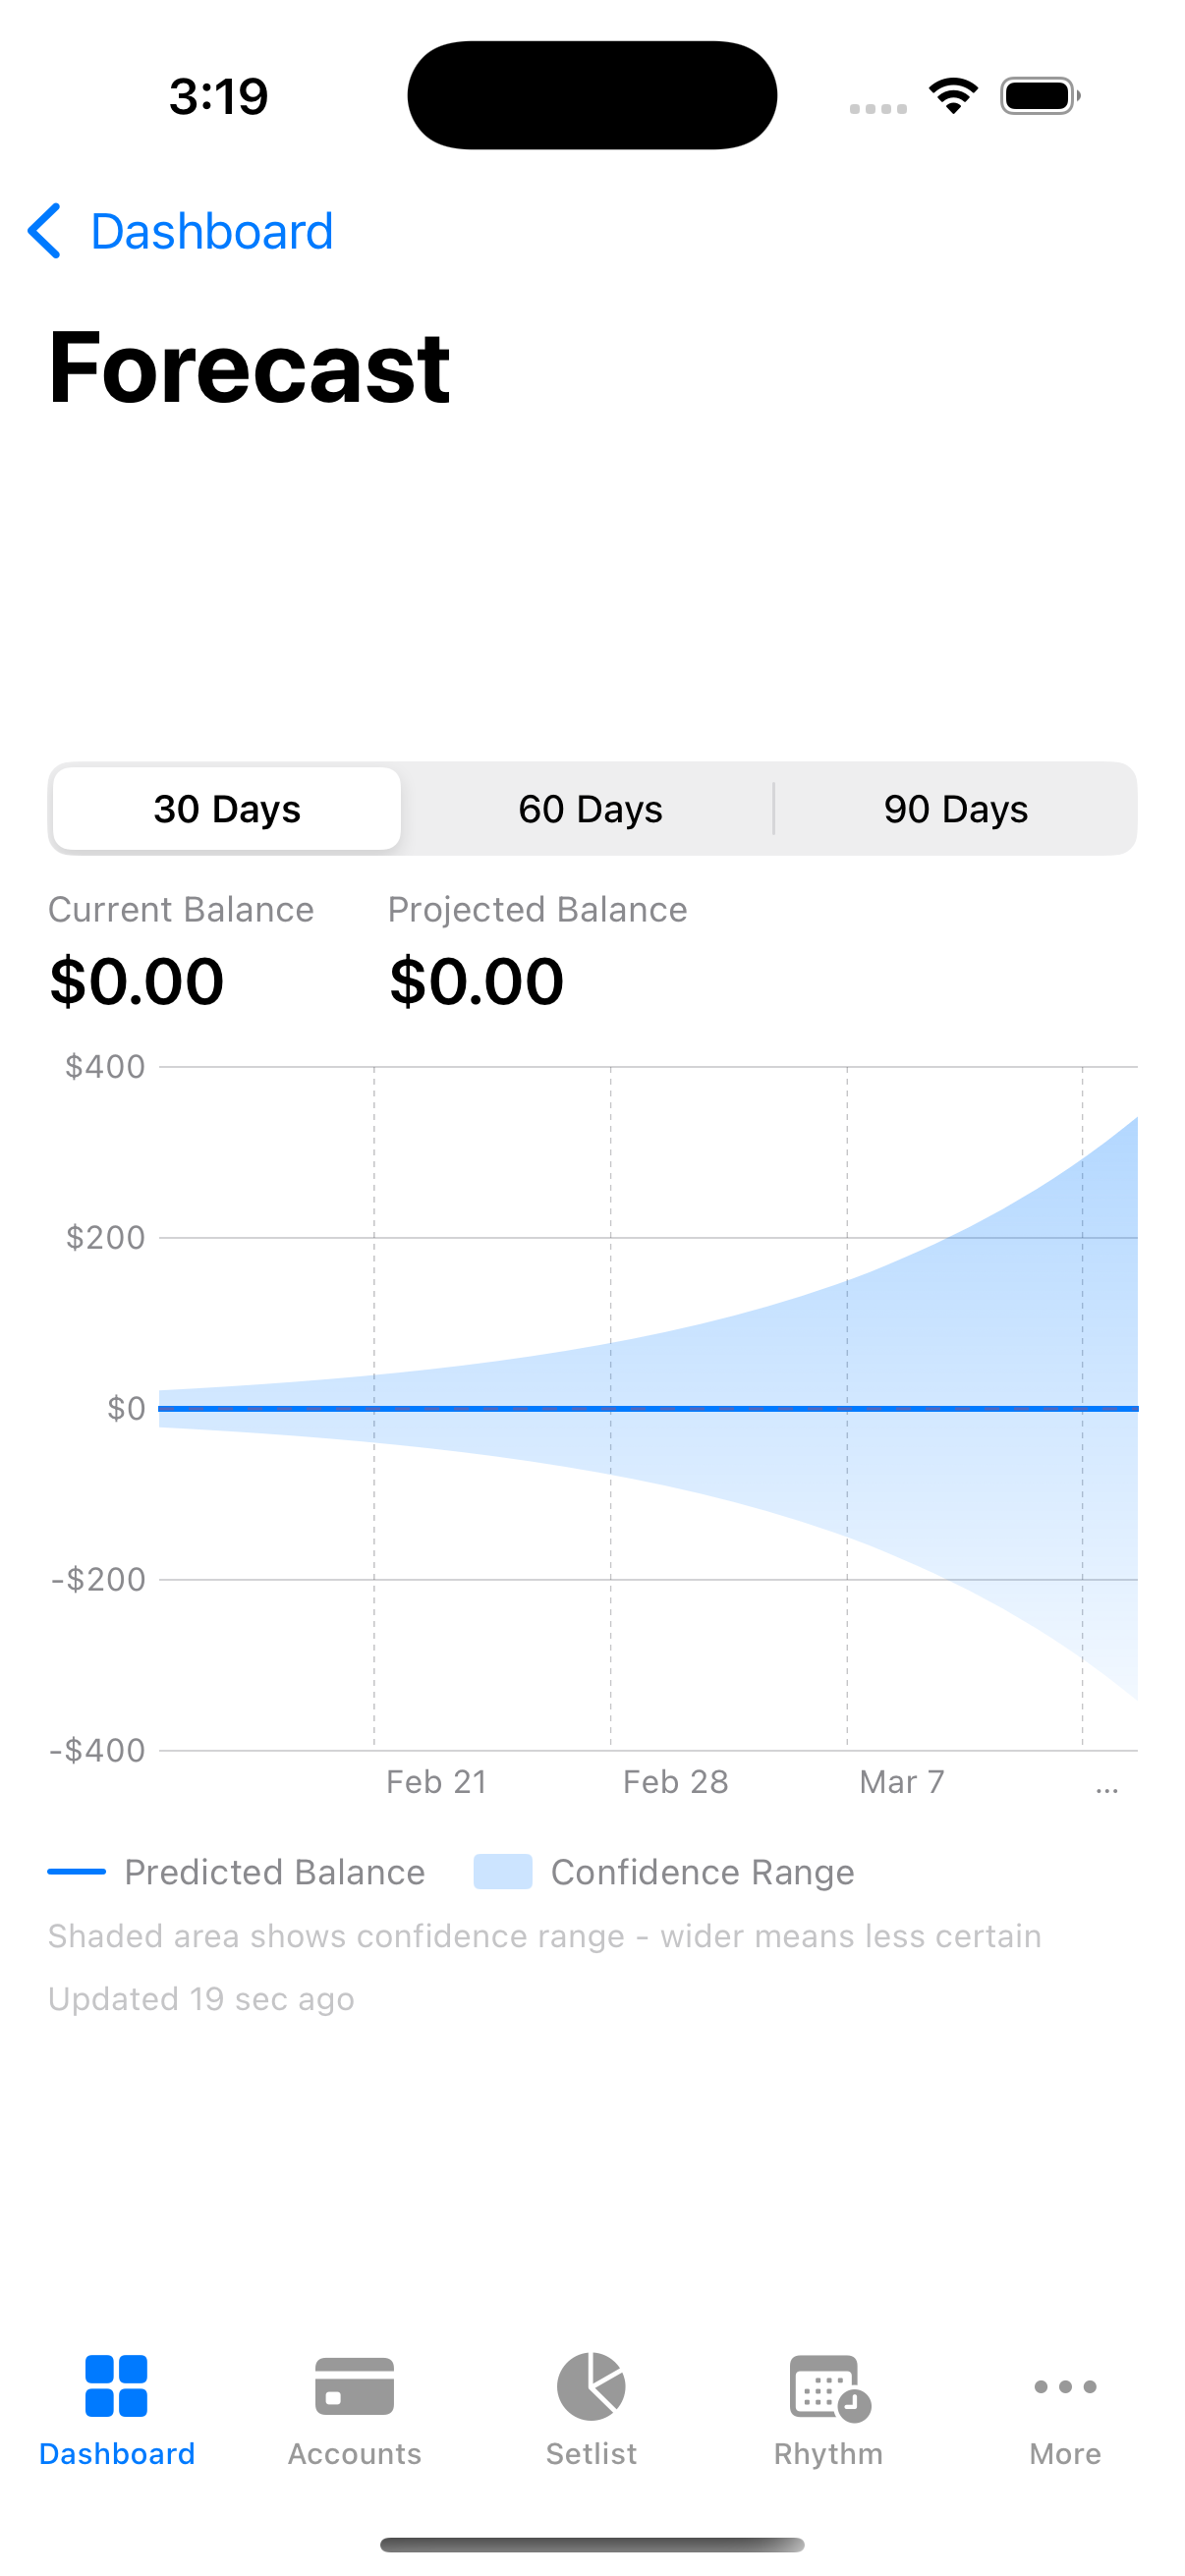
The Forecast projects your balance 30 days ahead based on recurring bills and income, with low balance warnings.
How Forecast Works
Forecast builds its projection from three data sources:
-
Current balance — the combined balance of all your active accounts. This is the starting point of the projection.
-
Historical spending and income — Forecast analyzes your last 90 days of transactions to calculate a net daily cash flow rate (income minus discretionary expenses). This captures your day-to-day spending habits that are not tied to specific recurring bills.
-
Rhythm bills (recurring rules) — your active recurring payment rules (subscriptions, rent, utilities, loan payments, and so on) are projected forward on their specific due dates. Forecast knows whether a bill is weekly, biweekly, monthly, quarterly, semi-annual, or yearly, and places each payment on the right day in the timeline.
To avoid counting recurring bills twice — once in the daily rate and again on their specific dates — Forecast calculates the daily equivalent of your recurring expenses and removes it from the general daily rate. This way, recurring charges appear only on the days they are actually due, while the daily rate reflects only your discretionary spending.
Reading the Forecast Chart
The Forecast chart displays three visual elements:
Predicted Balance Line
The solid blue line shows the most likely path your balance will follow over the selected time window. It rises when income is expected and drops when bills come due or daily spending accumulates.
Confidence Range
The shaded blue area surrounding the prediction line represents the confidence range. This band shows where your balance is likely to fall, accounting for normal variation in your spending.
- Near-term predictions (the next few days) have a narrow band because there is less uncertainty.
- Longer-term predictions have a wider band because more things can change over time.
The chart legend explains that “wider means less certain,” which is the key to reading the shaded area.
Zero Line
A dashed red line at the $0 mark serves as a visual reference. If the prediction line crosses below this, Forecast will trigger a low balance warning.
Balance Summary
Above the chart, two numbers are displayed side by side:
- Current Balance — your actual combined account balance right now.
- Projected Balance — the predicted balance at the end of the selected time window, with an arrow indicator showing the expected change (green for increase, red for decrease).
Forecast Time Window
You can choose from three forecast ranges using the segmented picker above the chart:
| Range | Best For |
|---|---|
| 30 Days | Near-term planning with higher confidence. Shows weekly date labels on the chart. |
| 60 Days | Medium-term view that captures most monthly billing cycles twice. Shows biweekly date labels. |
| 90 Days | Long-range planning. Useful for spotting seasonal patterns or upcoming large bills, but confidence decreases significantly. Shows roughly monthly date labels. |
Changing the range reloads the forecast automatically.
Low Balance Warnings
When Forecast predicts that your balance will drop below zero at any point during the selected time window, a Low Balance Alert banner appears below the chart. The banner includes:
- An orange warning icon.
- A message stating the approximate date when your balance may dip below zero, such as “Your balance may drop below zero around Mar 15, 2026.”
- Advice to review upcoming bills and plan ahead.
Dashboard Preview
On your main dashboard, a compact Forecast widget gives you a quick glance at your cash flow without opening the full chart. The widget shows:
- Your current balance and projected balance side by side with an arrow between them.
- The net change amount (green or red).
- If a low balance warning is active, a teaser message with the projected negative-balance date.
- A “View forecast” link to open the full chart.
If the projected balance is negative, it appears in red in both the widget and the full chart.
Promo Deadline Tracking
If you have active Buy Now, Pay Later (BNPL) loans with promotional interest-free periods, Forecast displays a Promo Deadlines section below the chart. Each deadline card shows:
- The merchant name and BNPL provider.
- The promotional expiration date and days remaining.
- The remaining balance you need to pay off before the promo ends.
- The estimated deferred interest that will be charged if the balance is not paid in full by the deadline.
Deadline cards are color-coded by urgency:
| Days Remaining | Color |
|---|---|
| 30 or fewer | Red |
| 31 to 60 | Orange |
| 61 to 90 | Yellow |
| More than 90 | Green |
Accuracy Factors
Forecast is a projection, not a guarantee. Here is what affects its reliability:
What Improves Accuracy
- More transaction history. Forecast uses up to 90 days of data. The more consistent history it has, the better it can estimate your daily spending patterns.
- Complete Rhythm setup. When all your recurring bills are tracked as Rhythm rules with correct amounts and intervals, Forecast can place them precisely on the right dates.
- Consistent spending habits. If your discretionary spending is relatively stable week to week, the daily rate calculation will be more accurate.
- Shorter time windows. The 30-day forecast is inherently more reliable than the 90-day forecast because there is less time for unexpected changes to accumulate.
What Limits Accuracy
- Irregular income. If your income varies significantly (freelance work, commissions, bonuses), Forecast may over- or under-estimate incoming funds.
- Upcoming large purchases. Forecast does not know about future one-time expenses that you are planning. A large purchase will shift the actual balance away from the projection.
- New or changed subscriptions. If you recently started or canceled a subscription that is not yet reflected in your Rhythm rules, the forecast will not account for the change until the rules are updated.
- Confidence degradation over time. Forecast starts at approximately 95% confidence on day 1 and degrades to approximately 50% by day 90. The widening confidence band on the chart reflects this.
Platform Differences
iPhone iPad iPhone and iPad
- The Forecast widget appears on your main dashboard as a compact card.
- Tapping “View forecast” opens the full chart in a scrollable detail view.
- The full chart view is titled “Forecast” in the navigation bar.
Mac Mac
- The Forecast widget appears on the main dashboard in the same compact card format.
- Clicking “View forecast” navigates to the full chart view.
- The wider screen provides more room for the chart and the balance summary, but the layout and functionality are otherwise identical.
Tips
- Check Forecast after adding new Rhythm rules. When you add a recurring bill, refresh the forecast to see how it affects your projected balance.
- Use the 30-day view for decisions. If you are deciding whether to make a purchase this week, the 30-day window gives the most reliable picture of your near-term cash position.
- Watch the confidence band, not just the line. If the shaded area is very wide, it means there is significant uncertainty. The actual outcome could fall anywhere within that range.
- Act on low balance warnings early. The earlier you spot a potential shortfall, the more options you have to adjust — whether that means delaying a purchase, moving money between accounts, or picking up extra work.